TOO MUCH DATA, TOO MANY MANUAL STEPS?
Let's automate it — so you can focus on what matters.
CHECK OUT MY PORTFOLIO
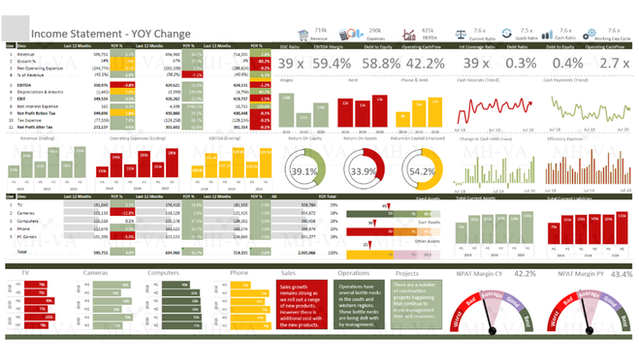
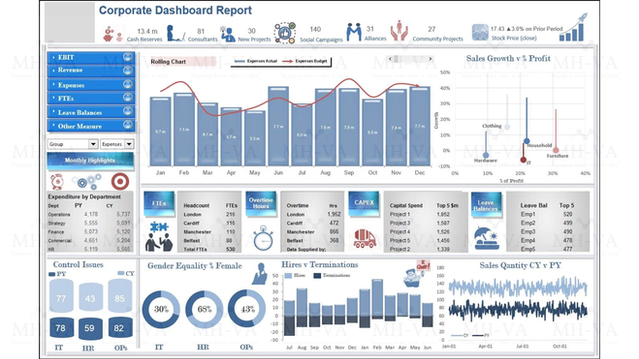
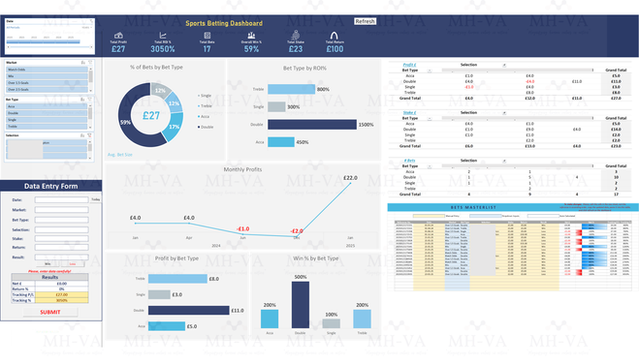
1. Interactive Dashboards
- Ready to see your data in action?
- These dashboards transform plain numbers into interactive visuals you can explore in just a few clicks.
- From sales, customer analytics, and project tracking to deep financial insights, they give you real-time clarity and confidence to make smarter decisions.
- Track performance, uncover trends, and share insights with your team — all in one view.
2. Finance Trackers | Digital Planning | Journaling | Notion Templates
- Want an easier way to manage your money and plans?
- These templates make budgeting, planning, and journaling simple, clear, and stress-free.
- Whether you’re setting up a monthly budget, annual goals, or a digital planner, everything is organized to keep you on track.
- Take control of your finances and life today with these Notion-powered tools.
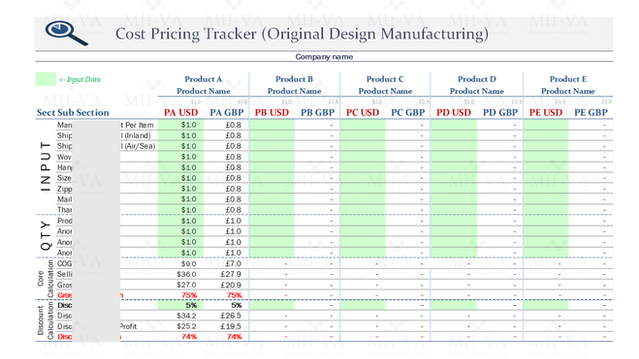
3. Excel Computations
- Tired of time-consuming manual calculations?
- These Excel trackers and forecasting sheets handle complex formulas for you.
- From pricing and staffing plans to accurate forecasts, each tool saves time while ensuring precision.
- Just plug in your data and let Excel handle the heavy lifting.
4. Narrative Report
- Numbers alone don’t tell the whole story.
- These reports combine clean visuals with meaningful insights to bring your data to life.
- Whether you’re analyzing trends, performance, or efficiency, they’re structured and professional for any audience.
- Present your findings with confidence and clarity every time.
5. Website (Wordpress & WIX)
- Your website is your digital home.
- From sleek WIX setups to powerful WordPress builds, these projects combine design and functionality.
- Each site is customized to be clean, smooth, and built for your brand’s growth.
- Launch a website that works as hard as you do.
6. Digital Forms
- Still collecting data the hard way?
- Digital forms make it quick and easy to gather and organize information accurately.
- Whether for business, events, or personal use, these forms are intuitive, efficient, and tailored to your needs.
- Simplify your process and enjoy clean, structured data every time.
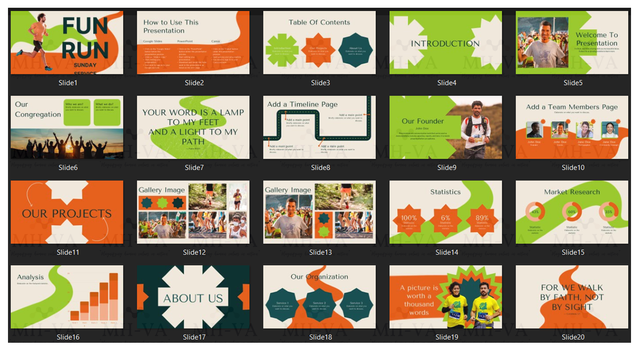
7. Visual Presentation (Power Point & Google SLide)
- Want to keep your audience hooked from the first slide?
- These presentations turn complex data and ideas into simple, engaging visuals.
- Perfect for meetings, pitches, or events, they’re designed to tell your story with clarity and style.
- Present with confidence — and leave a lasting impression.
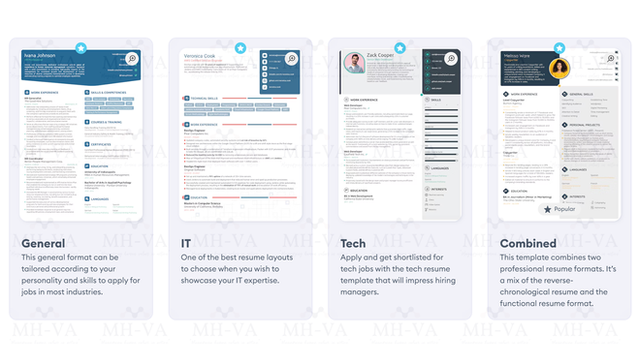
8. Resume Building
- Your resume is your ticket to new opportunities.
- These templates are modern, clean, and ATS-friendly to showcase your strengths.
- Highlight your skills and experience so you stand out in any industry.
- Start landing interviews with a professional, polished resume today.
9. Graphics Design
- Need visuals that speak louder than words?
- From logos and social graphics to posters and banners, every design is crafted to fit your style and audience.
- Clean, modern, and creative — perfect for business, marketing, or personal branding.
- Make your brand unforgettable with designs that truly connect.


